JUnitPerf 


API performance testing framework built using JUnit
JUnitPerf provides extensions to the JUnit4 & JUnit5 frameworks, allowing unittests to be extended to operate as performance evaluation tests.
This library is best suited for testing remote API endpoints or component/integration testing. If attempting to benchmark code blocks with nanosecond latency then you should consider using JMH
This library interface was heavily influenced by the interface in the deprecated Contiperf library developed by Lucas Pouzac
Contents
Usage Instructions
JunitPerf library supports both junit4 and junit5 bindings. Usage documentation for each binding can be found here:
Test Configuration Options
@JUnitPerfTest has the following configuration parameters:
| Property | Definition | Default value |
|---|---|---|
| threads | The total number of threads to use during test execution | 1 |
| durationMs | Total time to run the test in millisecs (ms) (includes warmup period) | 60,000 |
| warmUpMs | Warm up period in ms, test logic will be executed during warm up, but results will not be considered during statistics evaluation | 0 |
| maxExecutionsPerSecond | Sets the maximum number of iteration per second (disabled by default) | -1 |
| rampUpPeriodMs | Framework ramps up its executions per second smoothly over the duration of this period (disabled by default) | 0 |
| totalExecutions | A best effort target for the total number of times the test method should be executed, this setting takes precedence over durationMs (disabled by default) | -1 |
These configuration parameters can be overridden at runtime by specifying a VM args of the form: -Djunitperf.<param>=X
i.e. To set a test duration of 10 mins at runtime, specify -Djunitperf.durationMs=600000.
This will override the durationMs set in the @JUnitPerfTest annotation.
NOTE: Do not use “_” when defining runtime integer or long override values, i.e. use 600000 and not 600_000
@JUnitPerfTestRequirement has the following configuration parameters:
| Property | Definition | Default value |
|---|---|---|
| percentiles | Comma separated list of ms percentile targets, format: percentile1:limit,percentile2:limit (ie. 90:3.3,99:6.8) | ”” |
| executionsPerSec | Target executions per second | 1 |
| allowedErrorPercentage | Allowed % of errors (uncaught exceptions) during test execution (value between 0 and 1, where 1 = 100% errors allowed) | 0 |
| minLatency | Expected minimum latency in ms, if minimum latency is above this value, test will fail | disabled |
| maxLatency | Expected maximum latency in ms, if maximum latency is above this value, test will fail | disabled |
| meanLatency | Expected mean latency in ms, if mean latency is above this value, test will fail | disabled |
Reports
HTML Reports
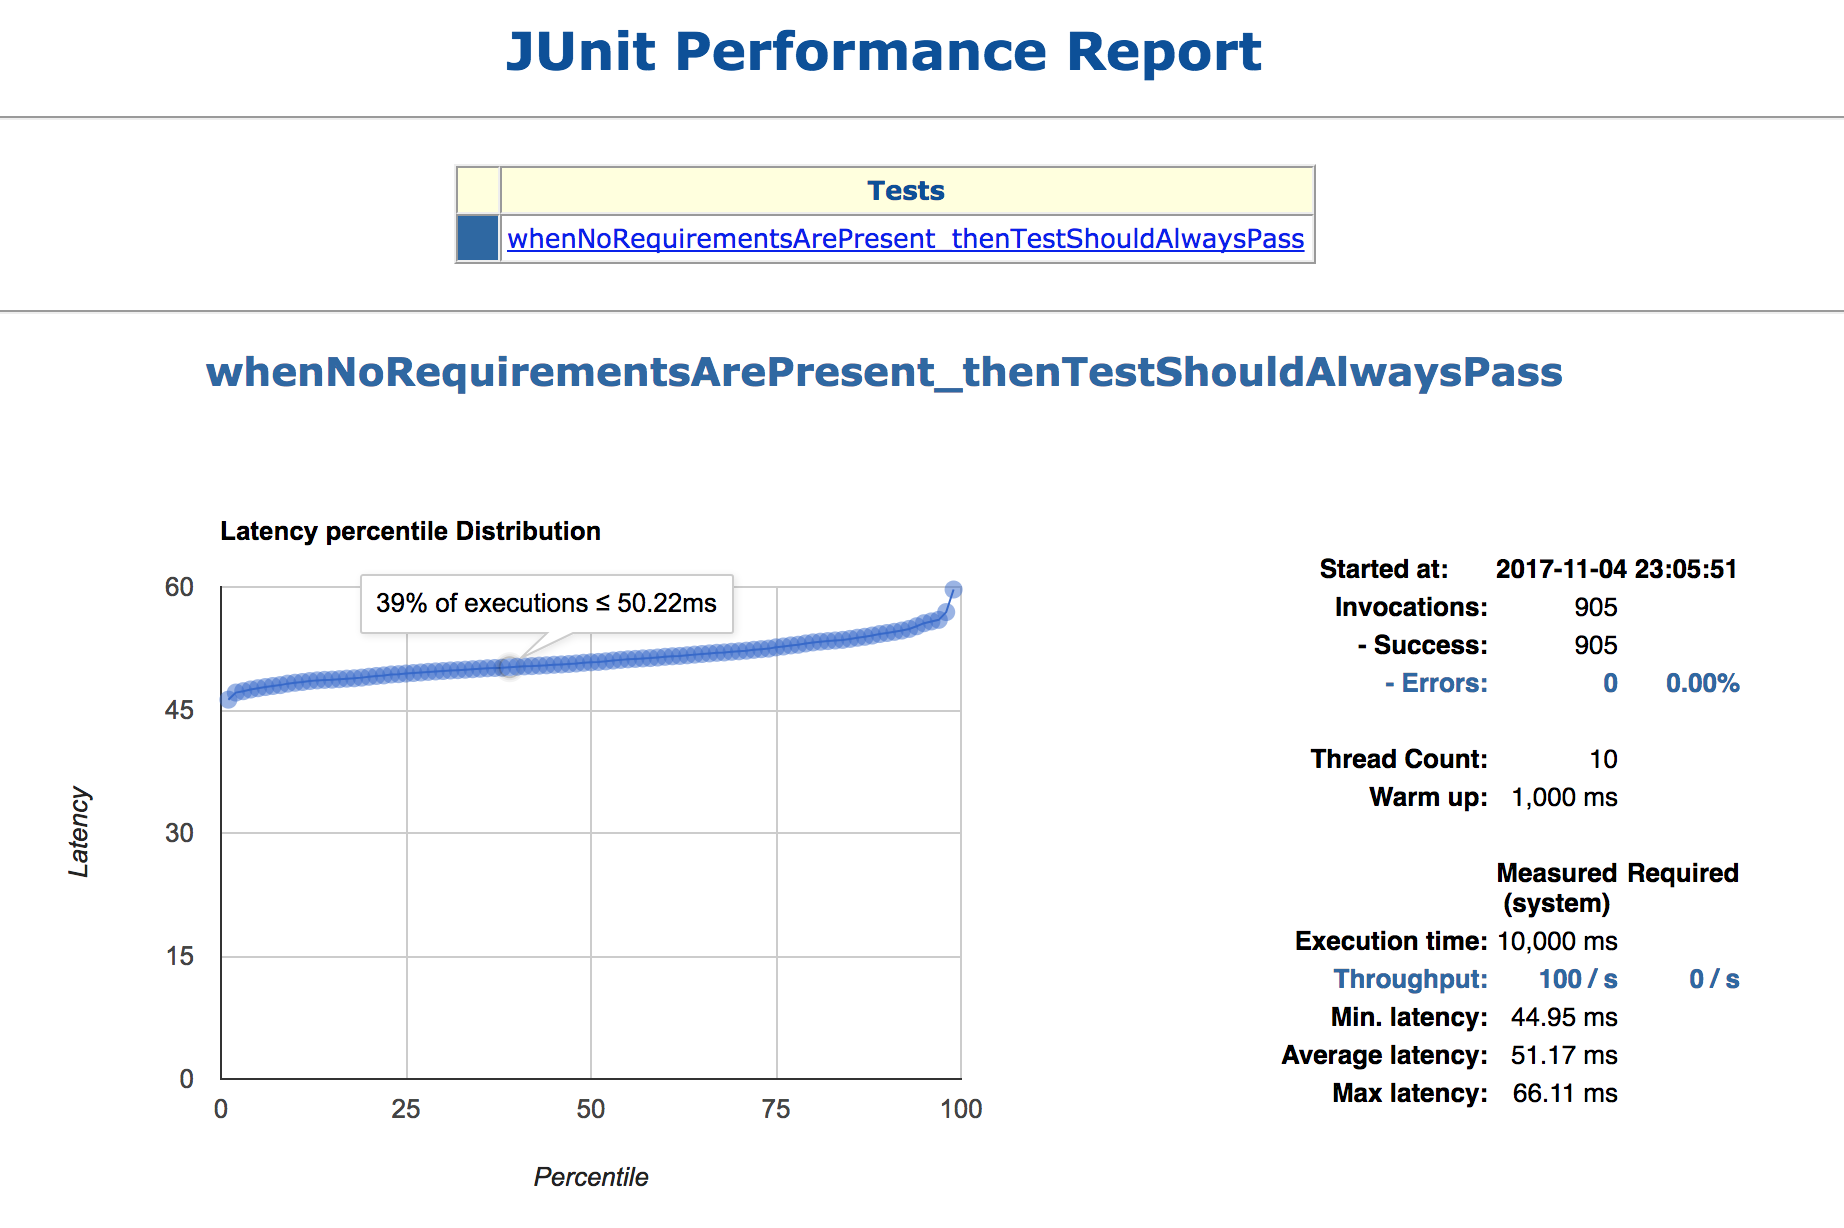
An example Html report can be seen below:

Hovering over the datapoints on the percentile latency graph will provide latency/percentile information.
The HTML reporter will generate an HTML performance report under ${BUILD_DIR}/reports/junitperf_report.html
It is possible to override the template by placing a customised src/main/resources/templates/report.template file on the classpath ahead of the default template.
Console Reporting
It is also possible to use one of the other built-in reporters, the console reporter. for example:
Example output:
15:55:06.575 [main] INFO  c.g.n.j.r.p.ConsoleReportGenerator - Started at:   2017-10-28 15:55:05
15:55:06.580 [main] INFO  c.g.n.j.r.p.ConsoleReportGenerator - Invocations:  765
15:55:06.580 [main] INFO  c.g.n.j.r.p.ConsoleReportGenerator -   - Success:  765
15:55:06.580 [main] INFO  c.g.n.j.r.p.ConsoleReportGenerator -   - Errors:   0
15:55:06.580 [main] INFO  c.g.n.j.r.p.ConsoleReportGenerator -   - Errors:   0.0% - PASSED
15:55:06.581 [main] INFO  c.g.n.j.r.p.ConsoleReportGenerator -
15:55:06.581 [main] INFO  c.g.n.j.r.p.ConsoleReportGenerator - Thread Count: 1
15:55:06.581 [main] INFO  c.g.n.j.r.p.ConsoleReportGenerator - Warm up:      0ms
15:55:06.581 [main] INFO  c.g.n.j.r.p.ConsoleReportGenerator -
15:55:06.581 [main] INFO  c.g.n.j.r.p.ConsoleReportGenerator - Execution time: 1000ms
15:55:06.581 [main] INFO  c.g.n.j.r.p.ConsoleReportGenerator - Throughput:     766/s (Required: 10000/s) - FAILED!!
15:55:06.581 [main] INFO  c.g.n.j.r.p.ConsoleReportGenerator - Min. latency:   1.012392ms
15:55:06.582 [main] INFO  c.g.n.j.r.p.ConsoleReportGenerator - Max latency:    3.74209ms
15:55:06.582 [main] INFO  c.g.n.j.r.p.ConsoleReportGenerator - Ave latency:    1.2975845ms
15:55:06.583 [main] INFO  c.g.n.j.r.p.ConsoleReportGenerator -
CSV Reporting
It is also possible to use the built-in CSV reporter.
The CSV reporter will generate a CSV file at the default location ${BUILD_DIR}/reports/junitperf_report.csv.
The CSV output will have the following format:
testName,duration,threadCount,throughput,minLatencyMs,maxLatencyMs,meanLatencyMs,percentileData
unittest1,10000,50,101,500000.0,1.430,6.430,1:0.0;2:0.0;3:0.0;4:0.0;5:0.0; ... ;98:4.03434;99:4.83434680
NOTE: the percentileData is formatted as percentile1:latency;percentile2:latency; ...
Statistics
By default, statistics are captured and calculated using the apache Descriptive Statistics library. See DescriptiveStatisticsCalculator for more details.
The default statistics calculator has an “infinite” size sampling window.
As a result, long-running tests may require a lot of memory to hold all test samples.
The window size may be set to a fixed size as follows : new DescriptiveStatisticsCalculator(1_000_000)
Build Instructions
To compile this project and run tests execute the following command from the root project directory: ` mvn clean test -Dgpg.skip`
To generate a library jar execute: mvn clean package -Dgpg.skip
Intellij 14 Setup
To run/add to this project using intellij you will require the following plugins:
- Lombok
- CodeStyle Formatter
To configure your IntelliJ settings to use this formatter:- IntelliJ IDEA > Preferences > Editor > Code Style > Scheme > Project (Apply Settings)
To resolve issues with lombok annotations not being compiled during a module make try setting the following preference:
- Go to the preferences (settings) menu
- Search for the “Compiler” section in the dialog window and then go to the “Annotation Processors” subsection
- Tick the checkbox reading “Enable annotation processing”